Chat marketing KPIs are the small set of numbers that tell you whether your DMs are doing real work or just feeling busy. Most creators measure the wrong thing — follower count, total messages sent, the number of flows they have built — and miss the handful of metrics that actually predict revenue. A DM channel can look healthy on the surface, with thousands of conversations a month, while quietly leaking buyers at every step. The only way to see the leak is to measure the right eight numbers and read them as a connected funnel.
This guide walks through those eight KPIs in the order a conversation actually moves through them: how a person enters your DMs, whether they reply, whether they qualify, whether they convert, how fast you respond, whether your follow-up works, how many people leave, and what each conversation is worth. For each one you get a plain-English definition, what a healthy range looks like in qualitative terms, and concrete levers to improve it. We do not invent precise benchmarks, because no honest universal number exists — funnels vary too much by audience, offer, and channel. What we give you instead is a framework you can apply to your own baseline.
Full disclosure: we build KlyoChat, an AI-native unified inbox, so when we get to the section on tooling we are describing our own product. We have kept the rest of the guide tool-agnostic — the eight KPIs matter no matter what software you run them in.
One more framing note before we start. These eight numbers are deliberately a short list. You could measure dozens more — sentiment, average conversation length, messages per resolution, channel mix — and there is nothing wrong with any of them. But more metrics is not better measurement. A dashboard with forty numbers is a dashboard nobody reads, and the ones that get watched are usually the comfortable ones rather than the decisive ones. The eight here are chosen because each maps to a distinct stage of the funnel and each has a clear lever you can pull. If you only ever track these, you will make better decisions than someone drowning in a richer but unreadable dashboard.
Why should you track chat marketing KPIs as a funnel, not a list?
The single biggest mistake in DM marketing metrics is treating each number as a standalone scorecard. Creators see a low conversion rate and immediately try to fix the offer or the closing message — when the real problem is three steps upstream, where 70 percent of people never replied in the first place. If only a sliver of your audience makes it past the second step, polishing the final step is rearranging deck chairs.
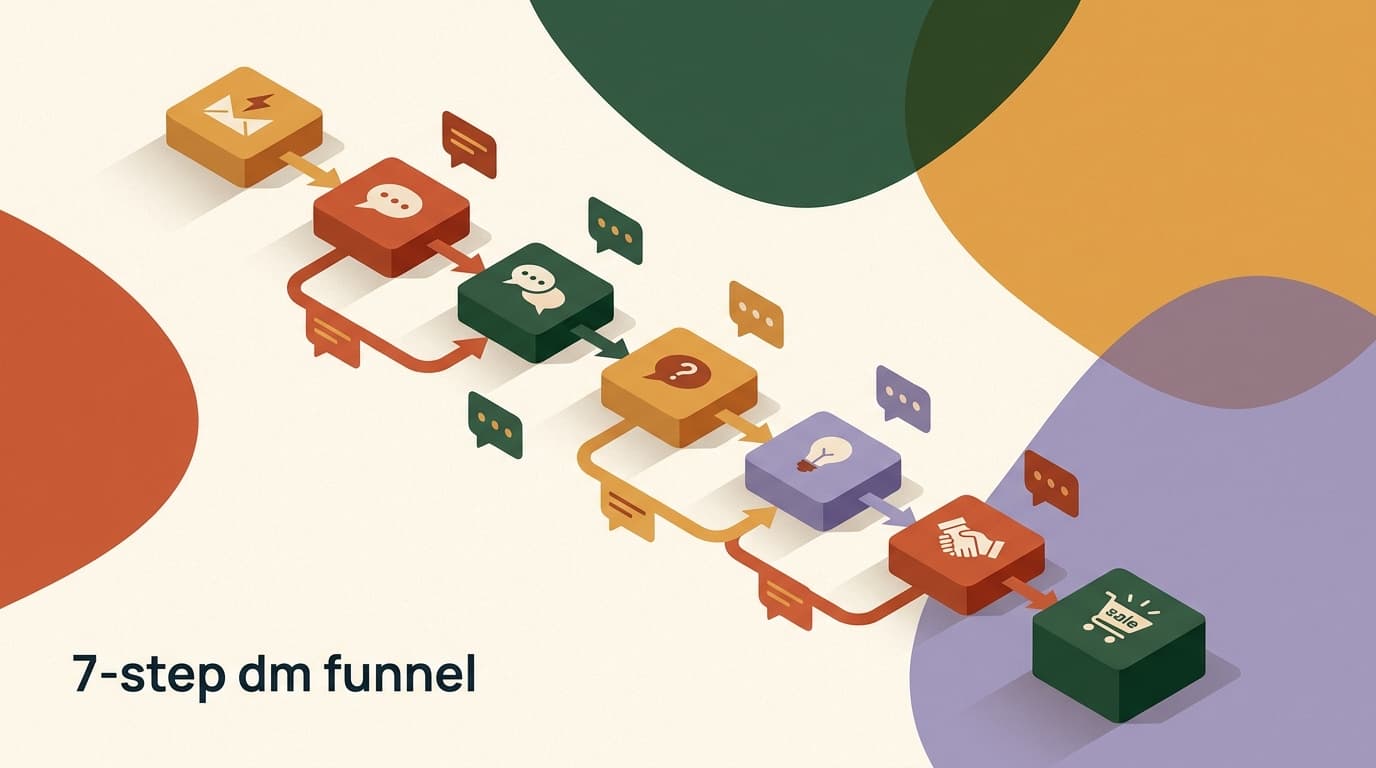
Every chat marketing KPI is a stage in one continuous journey. A person sees your content, triggers your DM, opens it, replies, qualifies, converts, and ideally comes back. Each KPI measures the survival rate from one stage to the next. Multiply the survival rates together and you get your end-to-end efficiency. That math is why the earliest leak matters most: a 10-point improvement at the top compounds through every stage below it, while the same improvement at the bottom only affects the handful of people who got that far.
So the discipline is simple. Measure all eight, then find the stage with the steepest drop-off relative to what is reasonable for your audience, and fix that one first. Re-measure. Find the next steepest drop. Repeat. This is unglamorous and it works far better than chasing whichever number happens to look ugly this week.
There is a second reason the funnel framing matters: it stops you from being fooled by totals. A creator can proudly report ten thousand conversations a month and assume the channel is thriving. But ten thousand conversations that mostly die at the response stage are worth less than two thousand that flow cleanly to a sale. Volume at the top hides weakness in the middle. The funnel view forces you to ask not how many conversations you started but how many survived each step — and that question is the one that actually correlates with money in the bank.
Find your steepest drop before you optimize anything
Lay your eight KPIs out as a funnel and look for the single stage where the most people fall out relative to what you would expect. Fix that stage first. Optimizing a later stage while an earlier one is hemorrhaging conversations is wasted effort.
KPI 1 — What is trigger rate and how do you improve it?
Trigger rate is the percentage of people exposed to a call-to-action who actually start a conversation. If a Reel reaches 50,000 people and 1,500 comment your keyword or tap your DM prompt, your trigger rate on that piece is 3 percent. This is the very top of the chat funnel, and it is the most leveraged number you have, because everything downstream is a fraction of the conversations that start here. Double your trigger rate and, all else equal, you have doubled your entire funnel.
A low trigger rate almost always traces back to the content and the offer, not the DM system. People do not trigger because the reason to do so is weak, unclear, or buried. The fix lives in your hook, your CTA wording, and the perceived value of whatever waits on the other side of the message. A vague invitation to learn more performs far worse than a specific, valuable promise — a checklist, a price, a quick answer to a real question.
Trigger rate is also where you should resist vanity. A piece of content can go viral and produce a terrible trigger rate because it attracted the wrong audience. Reach without relevant intent is noise. Read trigger rate against qualified reach, not raw impressions.
It helps to track trigger rate per piece of content rather than as a single blended number. A blended trigger rate tells you the channel is roughly working; a per-post trigger rate tells you which hooks and which CTAs are pulling. Over a few weeks you will see a pattern: a small number of content angles produce most of your triggered conversations, and the rest barely move the needle. That pattern is a content strategy handed to you for free. Make more of what triggers, retire what does not, and your top-of-funnel number climbs without you touching the DM system at all.
- Make the CTA specific — name exactly what someone gets for triggering, not a vague invitation.
- Put the trigger instruction where attention already is: spoken in the first seconds, on-screen, and in the caption.
- Lower the effort: a single keyword comment converts better than asking people to find a link.
- Match the offer to the content's audience — a great hook on the wrong topic triggers the wrong people.
- Test one CTA variable at a time so you can attribute changes in trigger rate to a cause.
Weak vs strong trigger CTA
- Weak
- "Link in bio if you want to learn more" — diffuse, high effort, low intent
- Strong
- "Comment PRICING and I'll DM you the full breakdown" — specific, one step, clear payoff
KPI 2 — What do DM open rate and response rate tell you?
Once a conversation starts, two related numbers measure whether it stays alive. Open rate is the share of people who actually see your first message. Response rate — the more important of the two for DM marketing metrics — is the share who reply to it. On most social channels open rates run high because notifications pull people back in, so response rate is where the real signal lives. It tells you whether your opening message earned a second turn.
A low response rate after a healthy trigger rate is a classic and fixable pattern: people wanted what you offered, then your first message gave them nothing to react to. The usual culprits are an opener that dumps a wall of text, one that feels obviously automated, or one that asks for a commitment before giving any value. The opener's only job is to deliver on the trigger promise and make replying easy and natural.
Open and response rate are also your early-warning system for deliverability and trust. A sudden drop with no change in your messaging often means a platform is throttling automated sends, or your account has tripped a spam signal. Watch these two numbers for sharp breaks, not just slow trends.
There is a subtler use for response rate too: it tells you whether your automation sounds human. As more creators lean on AI and templates for the opener, audiences have gotten sharp at spotting a canned first message — and a message that reads as obviously robotic gets ignored even when its content is fine. If your response rate sags despite a strong, relevant opener, the problem may be tone rather than substance. The fix is to make the automated first message sound like something you would actually type, contractions and all, rather than a polished broadcast. Response rate is, in that sense, an honesty meter for your automation.
- Lead with the promised payoffDeliver what the trigger offered in the first line. Do not make people ask twice for the thing they already raised their hand for.
- Keep the opener short and humanOne or two sentences that sound like a person. Walls of text and obvious template language both kill response rate.
- End with one easy questionGive a single, low-effort next step — a yes/no or a quick choice — so replying feels natural rather than like work.
Response rate is the truest engagement signal in chat
Opens can be passive. A reply is an active choice to keep talking, which makes response rate the most honest early indicator that your opener is working. If response rate is low while trigger rate is high, the leak is your first message, not your content.
KPI 3 — What is qualification rate and why does it protect your time?
Qualification rate is the percentage of people who reply and turn out to be a genuine fit for your offer — the right need, the right intent, the budget or readiness to act. Not everyone who replies is a prospect. Some are curious, some grabbed the freebie and left, some are simply in the wrong segment. Qualification rate separates conversations worth investing in from conversations that will never convert no matter how well you handle them.
This KPI is unusual because higher is not always better in a vacuum. A very high qualification rate paired with a low trigger rate can mean your CTA is so narrow that you are filtering out people earlier than you need to. A very low qualification rate with a high trigger rate means your offer is attracting tire-kickers. The healthy zone is the one where you bring in enough volume and most of it is the right kind of person. You read qualification rate against trigger rate, never alone.
The lever here is the qualifying question — the moment you find out whether someone fits. Done well, it feels like helpfulness, not an interrogation. Done badly, it feels like a form, and good prospects drop. The art is asking the one question that reveals fit while still moving the conversation toward value.
Qualification rate is also the KPI that most rewards consistency, which is exactly why automation helps it. When you qualify by hand, you do it well on the conversations you are paying attention to and skip it entirely on the ones that arrive while you are busy. That inconsistency means your qualification data is not really measuring your audience — it is measuring your attention span. An assistant or AI agent that asks the same qualifying question on every single conversation gives you a clean, comparable signal: now a change in qualification rate reflects a real change in who is coming in, not a change in how diligent you happened to be that week. Reliable measurement requires reliable execution, and qualification is where that link is tightest.
- Ask the single most predictive qualifying question early, framed as helping you help them.
- Tighten or loosen your trigger CTA to control who enters — qualification starts upstream.
- Tag conversations by fit so you can measure qualification rate by source and content type.
- Do not over-qualify: every extra question is a chance for a real prospect to drop off.
- Let an assistant or automation handle qualification consistently so it happens on every conversation, not just the ones you remember.
Qualifying question, two framings
- Form-like
- "What's your budget and team size?" — feels like screening, prospects stall
- Helpful
- "Are you setting this up just for yourself or for a team? I'll point you to the right thing" — reveals fit, keeps momentum
KPI 4 — How do you read booking and conversion rate from DMs?
Conversion rate is the percentage of qualified conversations that produce the outcome you actually want — a booked call, a sale, a signup, a deposit. This is the number most people obsess over, and it does matter, but only as the end of the chain. A strong conversion rate on qualified conversations is the goal; a weak one tells you the close needs work, but only after you have confirmed the earlier stages are healthy.
When you measure conversion rate on DMs, be precise about your denominator. Conversion rate against everyone who triggered is a different number from conversion rate against qualified conversations, and the two answer different questions. Track both. The first tells you end-to-end funnel efficiency; the second isolates how good your closing actually is once fit is confirmed. Confusing them leads to fixing the wrong thing.
The levers for conversion are the ones every salesperson knows, adapted to chat: a clear next step, friction removed from that step, objections handled in the moment, and timing that matches the prospect's readiness. In DMs specifically, the biggest conversion killer is making someone leave the conversation to act — sending them to a long form or an external page when the action could have happened inline.
One pattern worth watching is the gap between qualified conversion and end-to-end conversion. If your qualified conversion is strong but your end-to-end number is weak, your closing is fine and your problem is upstream — not enough people are reaching the qualified stage. If both are weak together, the close itself needs work. This is the diagnostic power of carrying two denominators: the relationship between them points you to the right fix, where either number alone would leave you guessing. A creator who tracks only one conversion figure is essentially flipping a coin on whether to rewrite the offer or rework the content.
| Conversion metric | Denominator | What it answers |
|---|---|---|
| End-to-end conversion | Everyone who triggered | How efficient is the whole funnel? |
| Qualified conversion | Qualified conversations only | How good is my close once fit is confirmed? |
| Stage-to-stage conversion | People at the previous stage | Where exactly is the leak? |
Do not optimize conversion before the funnel above it is healthy
A great close on the 5 percent of people who survived a leaky funnel is worth far less than fixing the leak. Confirm trigger, response, and qualification are reasonable first. Conversion is the last number to fight for, not the first.
KPI 5 — Why is time-to-first-response the metric that quietly decides everything?
Time-to-first-response is the gap between when someone messages you and when they get a real reply. It is the response time metric that, more than any other single number, separates chat funnels that convert from ones that stall. Intent in DMs is perishable. A person who messages you while watching your Reel is warm; the same person two hours later has scrolled past forty other things and forgotten why they reached out. The longer the gap, the colder the lead, and the drop-off is steep, not gentle.
This is the KPI where chat marketing differs most sharply from email. In email, a same-day reply is fine. In DMs, the expectation is minutes, and on a viral post that produces hundreds of simultaneous conversations, no human can hold that line manually. This is the structural reason automation and AI exist in this category at all: not to replace the relationship, but to keep first response fast enough that the relationship is still possible. A bot that answers the obvious opener in seconds and hands a warm, informed conversation to a human beats a human who replies thoughtfully three hours too late.
Measure time-to-first-response at the percentile level, not just the average. An average can look fine while a long tail of conversations waits hours — and that tail is disproportionately your spiky, high-volume moments, which are exactly when the most leads are at stake. Watch the slowest 10 percent, because that is where revenue leaks during your best content.
It is worth being honest about what fast actually buys you. Speed does not close a sale on its own; a fast bad answer is still a bad answer. What speed does is keep the door open long enough for a good answer to land. Think of time-to-first-response as a permission window: respond inside it and the prospect is still receptive, miss it and even a perfect reply arrives to someone who has emotionally moved on. That is why this KPI sits in the middle of the list rather than the bottom — it does not directly produce revenue, but it gates the ability of every later stage to produce revenue. A funnel that is excellent at qualifying and closing but slow to respond is a funnel quietly capped by its weakest reflex.
- Automate the instant acknowledgmentEven a fast, relevant first reply that buys time keeps a lead warm. The gap between zero and any response is the most expensive gap in the funnel.
- Let AI handle the predictable openerMost first messages are variations of a handful of questions. An AI agent answering those in seconds collapses your response time at exactly the volumes humans cannot.
- Route only what needs a human, fastWhen a conversation needs you, it should land in front of you immediately with context, not sit in a queue you check twice a day.
Track the slow tail, not just the average
A healthy average time-to-first-response can hide a tail of conversations waiting hours — and that tail clusters around your highest-volume, highest-intent moments. Watch your 90th percentile response time, because that is where your best content is losing buyers.
KPI 6 — What is follow-up conversion and why do most creators leave it on the table?
Follow-up conversion is the share of conversations that convert because of a second, third, or later touch — not the first exchange. Most people do not buy, book, or sign up on the opening conversation. They get distracted, they need to think, life intervenes. The creators who win in DMs are not the ones with the best opener; they are the ones who follow up consistently with people who showed interest and then went quiet. This is the most neglected of all chat marketing KPIs, and often the largest pool of recoverable revenue.
The reason it gets left on the table is purely operational. Following up means remembering who went quiet, when, and what you were talking about — across hundreds of conversations. No one does this reliably by hand. The conversations that stalled simply scroll out of view and are never touched again. Measuring follow-up conversion forces the question: how much revenue am I losing to silence I never circled back on?
Good follow-up is not nagging. It is a relevant, well-timed nudge that adds value or removes the specific friction that stalled the conversation. The difference between a follow-up that converts and one that gets you muted is whether it feels like service or like pressure. Sequence and timing matter as much as the message itself.
When you start measuring follow-up conversion as its own number, something useful tends to happen: it changes how you treat a non-response in the first conversation. Without the metric, a prospect who goes quiet feels like a loss and you mentally write them off. With the metric, that same silent prospect is an asset — a known-interested person you have a documented chance of recovering. The number reframes silence from a dead end into a queue. And because the recovered revenue is genuinely large for most creators, follow-up conversion is often the fastest way to lift total revenue without changing your content, your offer, or your closing at all. You are simply collecting money you already earned and forgot to ask for.
- Define what counts as a stalled conversation — for example, qualified but no reply in 48 hours — so follow-up can be triggered consistently.
- Make the first follow-up add value or remove friction, not just ask "any thoughts?".
- Space follow-ups so they feel like care, not pursuit; two or three well-timed touches usually beats a barrage.
- Measure conversions attributable to follow-up separately, so you can see the revenue the second touch recovers.
- Automate the reminder to follow up even if a human writes the message — memory is the failure point, not the writing.
Follow-up that converts vs one that annoys
- Annoying
- "Just checking in! Any thoughts??" sent three times — adds nothing, reads as pressure
- Converts
- "You mentioned timing was the holdup — we just opened a slot next week if it helps" — relevant, removes the real blocker
KPI 7 — What does opt-out rate warn you about?
Opt-out rate is the percentage of people who unsubscribe, mute, block, or report your messages. It is the guardrail KPI — the one you watch not to grow but to make sure your other optimizations are not quietly poisoning the channel. You can juice trigger rate and follow-up volume in ways that lift short-term numbers while burning trust, and opt-out rate is how that damage shows up before it costs you the whole channel.
A rising opt-out rate is a direct message from your audience that something is too much: too frequent, too irrelevant, too pushy, or too obviously automated in a bad way. It is worth treating as a hard signal because the platforms treat it that way too. High report and block rates can throttle your reach or restrict your account, which means opt-out rate is not just a relationship metric — it is a deliverability and account-health metric. A spike here can quietly suppress every other number in this guide.
The goal is not zero opt-outs. Some unsubscribes are healthy; they remove people who were never going to convert and who would otherwise drag down your engagement signals. The goal is a low, stable rate. Watch for sudden increases tied to a specific campaign, a new automation, or a change in send frequency — those are the ones to act on immediately.
Opt-out rate also acts as a natural brake on the other seven KPIs, and that is by design. Almost every aggressive growth tactic that lifts a number in the short term — more follow-ups, more broadcasts, a pushier close — carries a risk of raising opt-outs. Keeping this metric in view forces a sustainable pace. If a change lifts conversion but also spikes opt-outs, you have not won; you have borrowed against the channel's future. Reading opt-out rate next to whatever you just optimized is how you tell the difference between a real improvement and a tactic that will hollow out your reach over the next quarter. It is the conscience of the dashboard.
- Treat any sudden spike as a stop-and-investigate event, not a number to average away.
- Map opt-outs to the message or campaign that triggered them to find the specific cause.
- Respect frequency: most opt-out spikes trace back to too many messages, too close together.
- Make leaving easy and honored instantly — fighting opt-outs drives reports and blocks, which are far worse.
- Read opt-out rate alongside reach: if the platform is throttling you, opt-outs and reports are often why.
Opt-out rate is a deliverability metric, not just a courtesy one
Blocks and reports feed the platform's spam signals. A spike does not only lose those individuals — it can suppress your reach to everyone, quietly dragging down trigger rate and every metric below it. Guard this number.
KPI 8 — How do you calculate revenue per conversation, and why is it the number that ties it all together?
Revenue per conversation is total revenue attributable to your DM channel divided by the number of conversations that produced it. It is the bottom-line chat marketing KPI — the one that translates every other metric into money and lets you make real decisions about where to spend time and budget. A funnel with a mediocre conversion rate but a high revenue per conversation can be far more valuable than a high-converting funnel selling something cheap. This number cuts through the percentages.
Revenue per conversation is powerful precisely because it is downstream of all seven other KPIs. Improve trigger rate and you have more conversations to spread revenue across, which can lower it in the short term even as total revenue rises — so always read it next to total revenue and conversation volume, never alone. Improve qualification and conversion and revenue per conversation climbs. Add follow-up conversion and it climbs further as you recover sales you used to lose. It is the single number that tells you whether the whole machine is getting more efficient at turning attention into income.
Use it to compare things that otherwise are not comparable: which content source produces the most valuable conversations, whether a new offer is worth promoting, whether spending more time in DMs pays off versus spending it elsewhere. When you can attribute revenue to the conversation that produced it, every other KPI gets a price tag, and prioritization stops being guesswork.
The catch — and it is worth naming — is attribution. Revenue per conversation is only as trustworthy as your ability to connect a sale back to the conversation that produced it. In a clean setup where the purchase happens inside or right after the chat, this is straightforward. In a messier reality where someone DMs you, disappears, and buys two weeks later from a link they found elsewhere, the conversation that did the real persuading may get no credit. You do not need perfect attribution to benefit from this KPI; you need consistent attribution, so the imperfections are the same month to month and the trend still means something. Aim for a definition you can apply the same way every time, then trust the direction of the number more than its absolute precision.
| If you improve... | Effect on revenue per conversation |
|---|---|
| Qualification rate | Rises — fewer wasted conversations dilute the average |
| Conversion rate | Rises — more conversations turn into revenue |
| Follow-up conversion | Rises — recovers revenue otherwise lost to silence |
| Trigger rate alone | Can dip short-term as volume grows; read with total revenue |
Always pair revenue per conversation with total revenue
Revenue per conversation can fall while you are winning — for example, when a surge of new conversations from better content has not converted yet. Judge it next to total revenue and conversation count so you are measuring efficiency, not penalizing growth.
How do these eight KPIs fit together in one dashboard?
Laid out in order, the eight KPIs form a complete chat funnel from first exposure to recovered revenue. Reading them top to bottom shows you the survival rate at each step, and reading the whole column shows you where attention turns into money — or where it stops. This is the entire point of measuring chat funnel metrics: not a wall of numbers, but a single story about where conversations live and die.
Here is the full set in sequence, with what each one diagnoses and the primary lever for moving it. Keep this view in front of you and your optimization work becomes obvious: find the worst-performing stage relative to what is reasonable for your audience, pull its lever, re-measure, repeat.
- Read the funnel top to bottom — the earliest leak compounds through everything below it.
- Fix one stage at a time and re-measure before moving on.
- Pair the percentage KPIs with absolute numbers so growth never looks like decline.
- Treat opt-out rate as a guardrail, not a growth metric, the whole time.
| KPI | Stage it measures | Primary lever |
|---|---|---|
| Trigger rate | Exposure to conversation started | Content hook and CTA specificity |
| Response rate | Conversation started to first reply | Opening message quality |
| Qualification rate | Reply to genuine fit | The qualifying question |
| Conversion rate | Qualified to outcome | The close and removing friction |
| Time-to-first-response | Speed across all of the above | Automation and AI for instant reply |
| Follow-up conversion | Stalled to recovered | Consistent, relevant follow-up |
| Opt-out rate | Trust and channel health | Frequency and relevance discipline |
| Revenue per conversation | The whole funnel in money | Improving every stage above |
What are the most common mistakes when tracking chat marketing KPIs?
Knowing the eight numbers is half the job; reading them well is the other half. A few mistakes show up again and again and quietly send people to optimize the wrong thing. Avoiding them is often worth more than any single tactic, because a misread KPI sends your effort in exactly the wrong direction for weeks.
The throughline of all of these errors is the same: measuring a number in isolation, out of context, or in a way that rewards activity over outcome. Chat marketing KPIs only mean something relationally — each against its neighbors, each against your own baseline, each against absolute volume.
- Optimizing the loudest number instead of the earliest leak — fixing conversion while response rate bleeds.
- Confusing averages with reality — a fine average time-to-first-response can hide an expensive slow tail.
- Reading conversion rate without specifying the denominator, so two different numbers get treated as one.
- Chasing trigger rate by attracting the wrong audience, which wrecks qualification and revenue per conversation.
- Ignoring opt-out rate until reach drops, by which point platform throttling has already set in.
- Tracking percentages with no absolute numbers, so healthy growth can look like a decline.
Compare to your own baseline, not someone else's benchmark
There is no honest universal benchmark for these KPIs — funnels vary too much by audience, offer, and channel. Establish your own baseline, then measure progress against it. A number that is improving for you matters more than one that matches a figure you read somewhere.
How does KlyoChat surface these chat marketing KPIs?
Most of the work in tracking these eight numbers is not the math — it is capturing the raw signals consistently across every conversation and channel. That is the gap we built KlyoChat to close. KlyoChat is an AI-native unified inbox that brings your social channels into one place, and its analytics surface exactly the inputs these KPIs are built from: conversation volume, response times, automation performance, and team activity. When the data is captured automatically, the funnel view above stops being a spreadsheet chore.
Response times in particular are where a unified inbox earns its keep. Time-to-first-response is the KPI humans cannot hold manually at scale, and KlyoChat's AI agents answer the predictable openers in seconds, then hand warm, qualified conversations to a person — so your fast tail and your slow tail both stay healthy during the spiky moments that matter most. The same surfaces show automation performance and team activity, so you can see which flows and which people are actually moving conversations forward.
We will be straight about the limits, because the rest of this guide has been. KlyoChat does not do native SMS or email — if your funnel depends on those channels, factor that in. And we are a newer, smaller community than the largest incumbents, so you will find fewer third-party templates and tutorials. What you get in exchange is AI-native response handling and the conversation analytics that make these KPIs measurable without manual bookkeeping. See the analytics page for what is surfaced, and the pricing page for plans.
The hard part is capturing the signals, not the arithmetic
These eight KPIs are easy to define and tedious to collect by hand across channels and conversations. A unified inbox that records response times, automation performance, and conversation volume automatically is what turns the funnel view from a manual audit into something you can actually watch. KlyoChat offers a 7-day free trial, no card required.
KlyoChat plans at a glance
- Basic
- $19/mo — unified inbox and automation to start tracking the core KPIs
- Pro
- $49/mo ($39 billed yearly) — custom AI agents and fuller analytics for response time and automation performance
- Business
- $129/mo — more seats and volume for teams managing chat funnels at scale
Chat marketing KPIs are not a scoreboard to admire — they are a diagnostic. Trigger rate, response rate, qualification rate, conversion rate, time-to-first-response, follow-up conversion, opt-out rate, and revenue per conversation form one funnel, and the discipline is to read them in order, find the earliest steep leak, fix it, and re-measure. Do that on repeat and the channel compounds.
Start by getting an honest baseline for all eight against your own numbers, not someone else's benchmark. Then pick the single stage costing you the most and pull its lever. For the strategy behind the funnel, see our piece on conversational marketing; for building the automated flows these metrics measure, see DM funnel automation; and for filling the top of the funnel, see turning content into DMs.